All numbers are for calendar years and fall general elections unless indicated otherwise. Numbers are rounded off. Candidate fundraising and spending totals are for Democratic and Republican candidates only. Financial activity by primary losers is excluded. A pdf version of this report is available.
Candidates
Number of legislative seats up for election in the 2014 general election: 116.
Number of candidates running for the legislature on the primary ballot in the 2014 general election: 247.
Number on the final ballot: 186.
Democrats: 86. Republicans: 91. Third Party and Independent: 9.
Number of legislative seats contested by candidates from both major parties in November 2014: 61.
Number of legislative seats where the winning candidate faced only Independent or Third Party ballot opposition in the general election: 6.
Democrats: 4. Republicans 2.
Number of those candidates who were incumbents: 5.
Democrats: 3. Republicans: 2.
Number of legislative candidates with no ballot opposition in the general election: 49
Democrats: 21. Republicans 28.
Number of those who were incumbents: 41.
Democrats: 18. Republican: 23.
Number of incumbents running for reelection in 2014: 87.
Democrats: 36. Republicans: 51.
Number of incumbents who lost in 2014: 3.
Democrats: 3. Republicans: 0.
Party representation in the Assembly before the 2014 fall election:
Democrats 39. Republicans 60.
Party representation in the Assembly after the 2014 fall election:
Democrats 36. Republicans 63.
Party representation in the Senate before the election:
Democrats 15. Republicans: 18.
Party representation in the Senate after the election:
Democrats 14. Republicans 19.
Votes
Votes for Assembly candidates in 2012:
Democrats: 1,417,359. Republicans: 1,250,190. Third-Party and Independents: 28,099.
Vote for Assembly candidates in 2014:
Democrats: 883,470. Republicans: 1,170,284. Third-Party and Independents: 23,187.
Percentage decrease of Democratic vote for Assembly from 2012 to 2014: 37.7%.
Republican: 6.4%.
Chart 1

*All voters for president or governor in the general election.
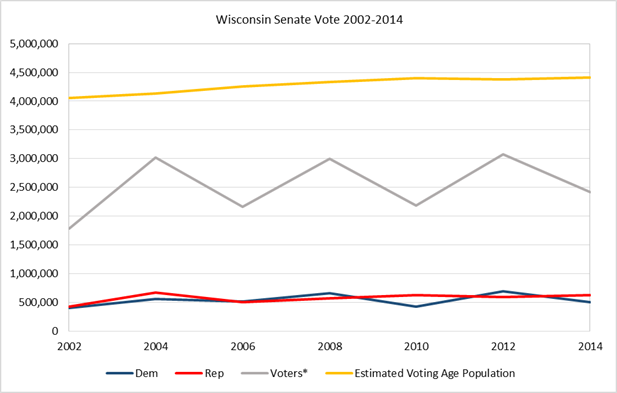
Vote for Senate candidates in 2012:
Democrats: 696,320. Republicans: 593,893. Third-Party and Independents: 13,118.
Vote for Senate candidates in 2014:
Democrats: 509,886. Republicans: 623,358. Third-Party and Independents: 20,020.
Percentage decrease of Democratic vote for Senate from 2012 to 2014: 26.8%. Republican increase of the vote for Senate from 2012 to 2014: 4.9%
Chart 2
*All voters for president or governor in the general election.
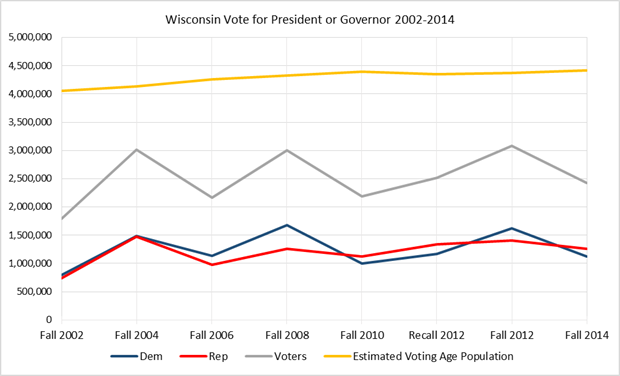
Vote for president in 2012:
Democrat: 1,620,985. Republican: 1,407,966
Vote for governor in 2014:
Democrat: 1,122,913. Republican: 1,259,706.
Percent decrease in Democratic vote from 2012 presidential election to 2014 election for governor: 30.7%. Republican: 10.5%.
Vote for president in 2008:
Democrat: 1,677,211. Republican: 1,262,393.
Vote for governor in 2010:
Democrat: 1,004,303. Republican: 1,128,941.
Percent decrease in Democratic vote from 2008 presidential election to 2010 election for governor: 40.1%. Republican: 10.6%.
Chart 3
2014 Income
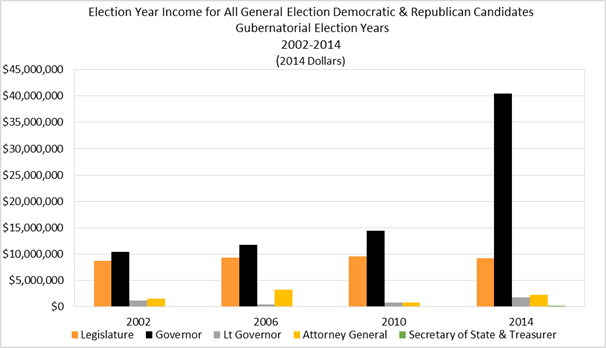
Total income from all sources (contributions and non-contribution income sources) for all major party candidates in the fall general election: $53.7 million.
Chart 4
Legislative Candidate Income
2014 income from all sources for Democratic and Republican general election legislative candidates: $9.2 million.
Chart 5

Total 2014 income for general election Democratic legislative candidates: $3.3 million.
Sources: $150,000 from candidate self-contributions; $2.3 million from individual contributions; $841,000 from political committee contributions; $7,000 from non-contribution income sources.
Chart 6

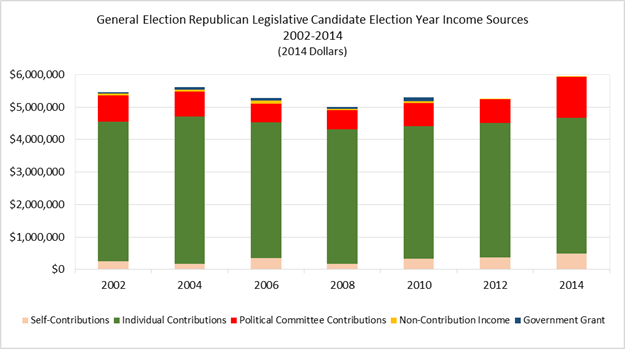
Total 2014 income for general election for Republican legislative candidates: $5.9 million.
Sources: $490,000 from candidate self-contributions; $4.2 million from individual contributions; $1.2 million from political committee contributions; $14,000 from non-contribution income sources.
Chart 7
Number of interest groups* that gave more money to general election Democratic legislative candidates in 2014 than Republican candidates in 2014: 7. (See Table 1 below.)
Table 1
Interest Groups* That Contributed More to General Election
Democratic Legislative Candidates in 2014 than Republican
| Interest | 2014 Dem Total | 2014 Rep Total |
|---|---|---|
| Retired/Homemakers/Non-income earners | $450,750 | $372,552 |
| Labor Unions | $435,589 | $102,810 |
| Lawyers/Law Firms/Lobbyists | $166,147 | $143,728 |
| Education | $131,043 | $36,732 |
| Civil servant/public employee | $111,716 | $57,627 |
| Unknown (Unreported/unclassified employers or generic occupations) | $76,207 | $61,209 |
| Non-Profit/Social Services | $40,591 | $26,230 |
| Total | $1,412,043 | $800,888 |
Number of interest groups* that gave more money to general election Republican legislative candidates in 2014 than Democratic candidates: 17.(See Table 2 below.)
Table 2
Interest Groups* That Contributed More to General Election
Republican Legislative Candidates in 2014 than Democratic
| Interest | 2014 Rep Total | 2014 Dem Total |
|---|---|---|
| Political/Ideological | $521,007 | $313,595 |
| Manufacturing & Distributing | $408,278 | $74,362 |
| Banking & Finance | $385,631 | $76,537 |
| Health Professionals | $357,809 | $152,586 |
| Construction | $344,262 | $40,357 |
| Agriculture | $278,623 | $58,090 |
| Business | $267,342 | $83,670 |
| Insurance | $260,208 | $55,758 |
| Health Services/Institutions | $237,514 | $63,843 |
| Real Estate | $210,250 | $43,454 |
| Road Construction | $194,104 | $7,000 |
| Tourism/Leisure/Entertainment | $177,129 | $36,092 |
| Transportation | $158,400 | $29,955 |
| Energy | $141,325 | $37,111 |
| Natural Resources | $129,682 | $22,299 |
| Telecommunications & Computers | $105,716 | $19,650 |
| Defense | $1,150 | $1,075 |
| Total | $4,178,430 | $1,115,434 |
Chart 8

Governor Candidate Income
2014 income from all sources for Democratic and Republican general election candidates for governor: $40.5 million (75.5% of all general election candidate income in 2014).
Chart 9

2014 income from all sources for the Democratic general election candidate for governor: $15.1 million.
Sources: $4.6 million from candidate self-contributions; $8.6 million from individual contributions, $1.9 million from political committee contributions ($803,000 of those from the Democratic Party of Wisconsin and $143,000 from running mate’s committee); $17,000 from non-contribution income sources.
Chart 10

2014 income from all sources for the Republican general election candidate for governor: $25.3 million.
Sources: $21.2 million from individuals contributions, $3.9 million from political committee contributions ($2.3 million of those from the Republican Party of Wisconsin and $1.1 million from running mate’s committee), $283,000 from non-contribution income sources.
Chart 11

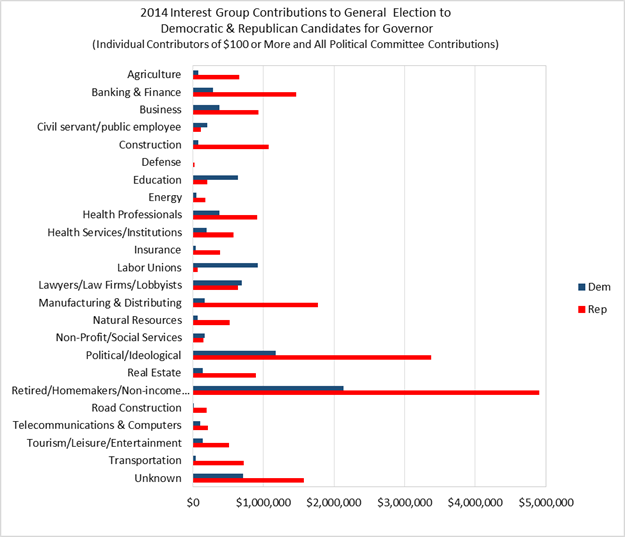
Number of interest groups* that gave more to the general election gubernatorial Democratic candidate in 2014 than the Republican: 5. (See Table 3 below.)
Table 3
Interest Groups* That Contributed More to the General Election
Democratic Candidate for Governor in 2014 than the Republican
| Interest | 2014 Dem Total | 2014 Rep Total |
|---|---|---|
| Labor Unions | $919,230 | $72,203 |
| Lawyers/Law Firms/Lobbyists | $698,568 | $640,645 |
| Education | $645,352 | $205,749 |
| Civil servant/public employee | $202,970 | $112,429 |
| Non-Profit/Social Services | $171,555 | $155,306 |
| Total | $2,637,675 | $1,186,332 |
Number of interest groups* that gave more to the general election gubernatorial Republican candidate in 2014 than the Democratic: 19. (See Table 4 below.)
Table 4
Interest Groups* That Contributed More to the General Election
Republican Candidate for Governor in 2014 than the Democratic
| Interest | 2014 Rep Total | 2014 Dem Total |
|---|---|---|
| Retired/Homemakers/Non-income earners | $4,904,595 | $2,133,807 |
| Political/Ideological | $3,378,589 | $1,178,316 |
| Manufacturing & Distributing | $1,771,537 | $168,438 |
| Unknown (Unreported/unclassified employers or generic occupations) | $1,572,829 | $709,184 |
| Banking & Finance | $1,464,534 | $285,176 |
| Construction | $1,075,643 | $82,056 |
| Business | $933,839 | $382,572 |
| Health Professionals | $915,169 | $382,348 |
| Real Estate | $894,670 | $143,256 |
| Transportation | $719,845 | $43,761 |
| Agriculture | $657,862 | $78,221 |
| Health Services/Institutions | $579,060 | $197,822 |
| Natural Resources | $526,107 | $72,020 |
| Tourism/Leisure/Entertainment | $514,882 | $142,494 |
| Insurance | $391,409 | $42,908 |
| Telecommunications & Computers | $214,448 | $102,518 |
| Road Construction | $197,837 | $11,635 |
| Energy | $179,153 | $54,933 |
| Defense | $29,322 | $9,532 |
| Total | $20,921,330 | $6,220,997 |
Chart 12
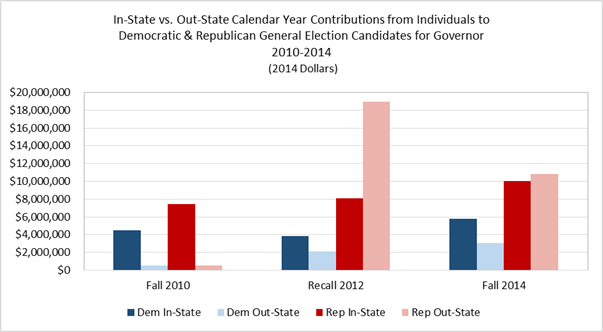
Amount of individual contributions with identifiable addresses to the Democratic and Republican general election candidates for governor from out of state: $13.9 million. (46.7% of all contributions with identifiable addresses.)
General election Democratic candidate for governor: $3.1 million (34.7%).
General election Republican candidate for governor: $10.7 million. (51.9%)
Chart 13
2014 Spending
Total spending (excluding committee to committee transfers) by all general election Democratic and Republican candidates in 2014: $58 million.
Chart 14

Legislative Campaign Spending
Total spending in 2014 by Democratic and Republican general election legislative candidates: $8.8 million.
Spending in 2014 by Democratic legislative candidates: $3.1 million. Republicans: $5.7 million.
Chart 15

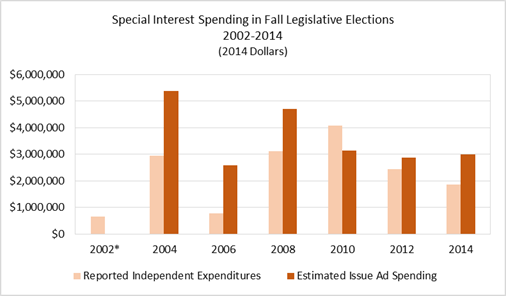
Special interest spending on legislative races in the form of "independent expenditures" and "issue ads" in 2014: $4.9 million.
Amount of that in the form of independent expenditures: $1.9 million.
In the form of undisclosed "issue ads:" $3 million.
Chart 16
Special interest spending in the fourteen 2011-2012 Senate recall elections in 2014 dollars: $40.5 million.
Amount spent on independent expenditures in the fourteen 2011-2012 Senate recall elections in 2014 dollars: $19.7 million.
Estimated amount spent on “issue ads” expenditures in the fourteen 2011-2012 Senate recall elections in 2014 dollars: $20.8 million.
Governor Campaign Spending
Total spending (excluding committee transfers) by the Democratic and general election candidates for governor in 2014: $46.3 million(79.8%of all general election candidate spending in 2014).
Amount spent by the Democratic general election candidate: $16.7 million.
Spent by the Republican general election candidate: $29.6 million.
Chart 17

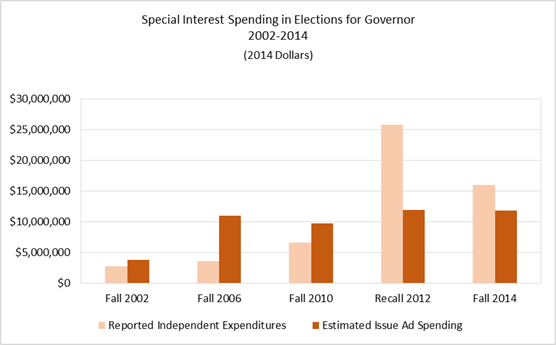
Special interest spending in the 2014 election for governor: $27.8 million.
Amount in the form of disclosed independent expenditures: $16 million.
In the form of undisclosed "issue ads:" $11.8 million.
Chart 18
*Interest groups are assigned to individual contributors of $100 or more to a candidate in 2014 and all party, PAC and candidate committee contributors. Contributions by a candidate to his or her own committee are excluded.